Leading Transit Agencies Use Viewpoint to Drive Smarter Service
From optimizing routes to improving rider satisfaction, public transit agencies are turning to Viewpoint for data-driven decisions that move cities forward. Explore customer case studies that show how your peers are solving real-world challenges with real results.
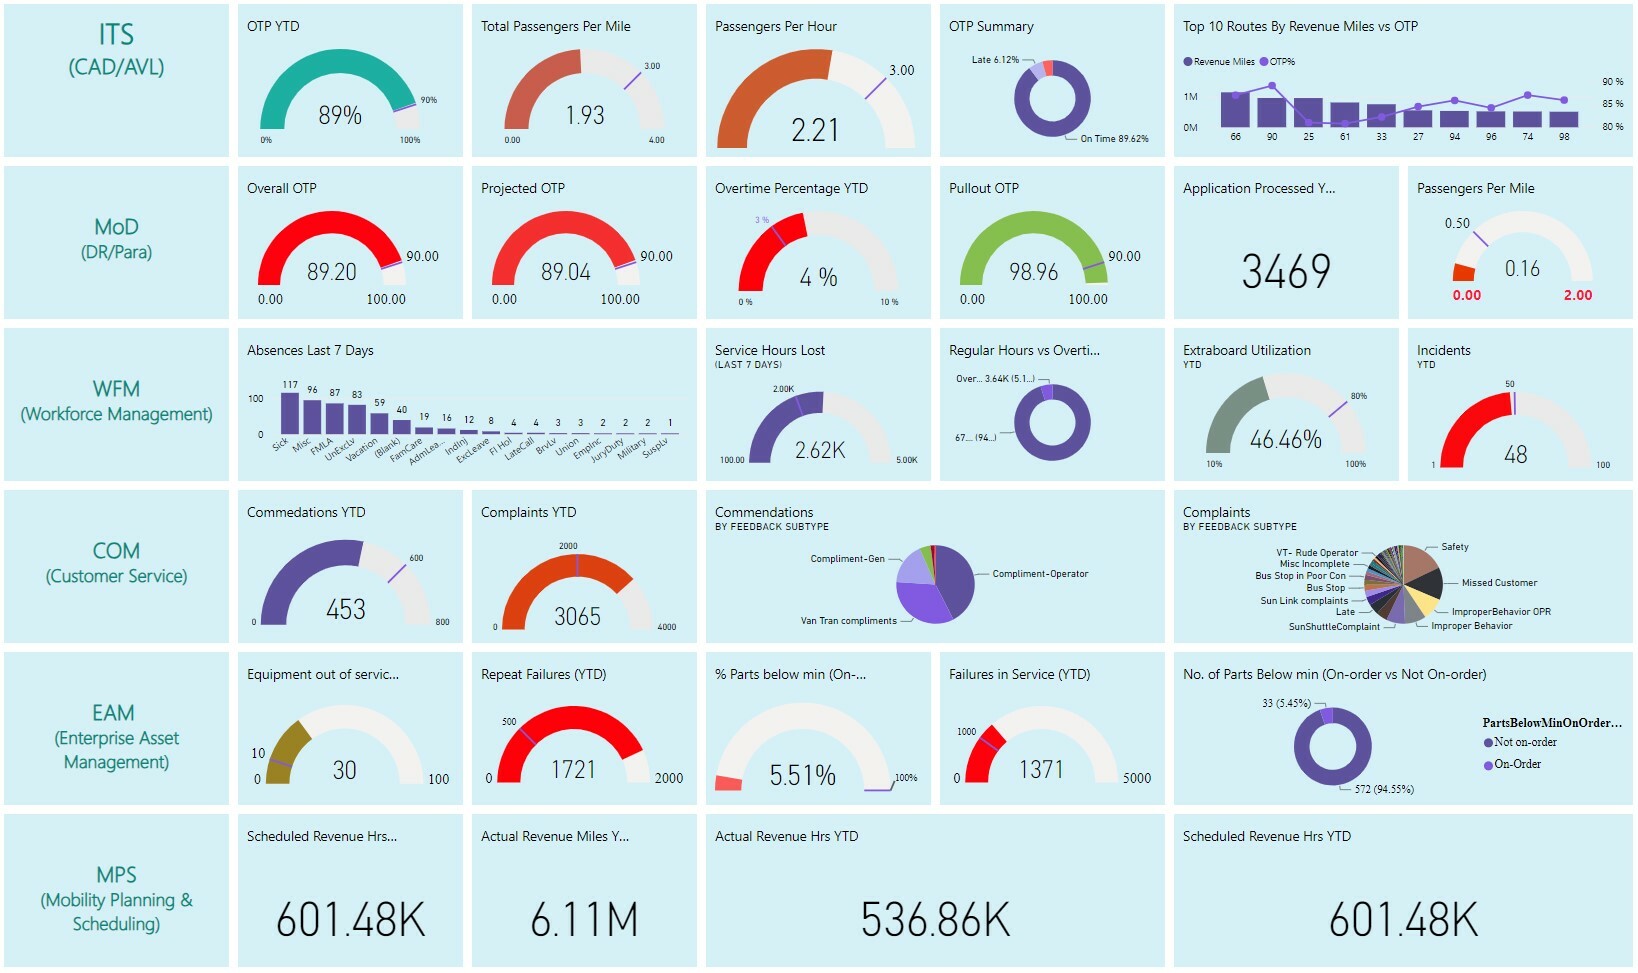
Effectively monitor and track your agency's critical KPIs
Use interactive dashboards, reports, and personalized metrics to get meaningful answers to tough questions. Our cloud-native BI solution, ViewPoint, integrates data from various sources to give you a view of your agency with ease.
ViewPoint is a secure, reliable platform that provides deeper visibility into your operational performance with minimal technical expertise.
Trusted by more than 60 transit agencies in North America, reducing their operational costs by 1-5% compared to alternative solutions.


Comprehensive Data
Understand what, why, and how things happen at your agency historically and in real-time
Self-Service Analytics
User-friendly reports produce intuitive dashboards to monitor your agency's critical KPIs
Actionable Intelligence
Make informed and proactive decisions for present and future planning
Workforce Management (OPS)
Plan effectively to minimize the impacts of workforce shortages and absences
Integrate ViewPoint with workforce management to promptly deliver critical information to your teams. Address absenteeism, shortages, inefficiencies, and more with user-friendly reporting that helps you improve processes and overcome obstacles.
-
Historical & Real-time Data
Leverage historical trends and real-time information for data-driven workforce planning decisions
-
Operational Impact
Accurately measure key workforce metrics and monitor performance with tailored alerts
-
Operator Performance
Utilize data to support programs and policies, and to track and optimize performance
Download Product Sheet
Running Times
Better understand your schedule performance to provide a more reliable service for your riders
Leverage personalized dashboards to analyze running times and create effective schedules for riders. ViewPoint Running Times makes it easy to identify optimal travel times by comparing schedules versus actual performance.
-
Optimize Route Planning
Analyzing granular data, such as node pairs, helps you better predict running times
-
Cost Analysis
Identify underperforming routes and adjust schedules to assess budgetary needs
-
Reliable Service
Compare scheduled data with actual performance to make adjustments and build a reliable service for riders
Download Product Sheet
PASS & Mobility on Demand (PASS)
Track paratransit and demand response metrics and trends in real-time
You aim to provide your paratransit riders with the best experience as efficiently as possible. With ViewPoint, you can make decisions to support service levels and proactively improve your riders' experience.
-
Monitor and Improve Operations
Gain real-time access to demand response metrics that matter most, like on-time performance trends, productivity, cancellations, and more
-
Improve Customer Service for Your Paratransit Riders
Real-time data at your fingertips leads to proactive decision-making to improve operations for your paratransit riders
-
Visibility of Contracted Operations
Improve oversight of service providers’ SLA (Service Level Agreement) performance , promoting transparency and accountability
Download Product Sheet
Enterprise Asset Management (EAM)
Drowning in asset and maintenance data? ViewPoint is here to help
Make impactful decisions and reduce costs with transit-tailored insights using ViewPoint. Now, you can break down datasets for work orders, assets, warranties, costs, and more with powerful visuals that make sense of your maintenance analytics.
-
Data Power
Get notified when your attention is required via alerts based on your defined KPIs and custom thresholds
-
Deep Analysis
Visualize, monitor, and analyze data spanning from assets and components, work orders, parts inventory, fuel and fluid consumption, and more
-
Centralized Analytics
Create a single source of truth across all departments for maintenance data
Download Product Sheet
Vontas OnRoute
Maximize service performance through intuitive reports and dashboards
Leverage your CAD/AVL system data to conduct intuitive analysis. ViewPoint allows you to measure how you're stacking up against your agency KPIs and helps you make data-driven decisions to achieve them.
-
Capture Performance
Generate reports to analyze and identify trends in OTP by the time of day, block, route, and stop
-
Ridership Analysis
Track ridership historically and in real-time
-
Prebuilt Reports
Get a head start with CAD/AVL-tailored reports with personalized KPIs and alerts
Download Product Sheet


.png?width=900&height=600&name=Untitled%20design%20(8).png)
.png?width=900&height=600&name=Untitled%20design%20(7).png)


